Not all block explorers are the same, some consist of simple call and rest APIs to aggregate data that can be hard to utilise for the everyday mainstream cryptocurrency user:
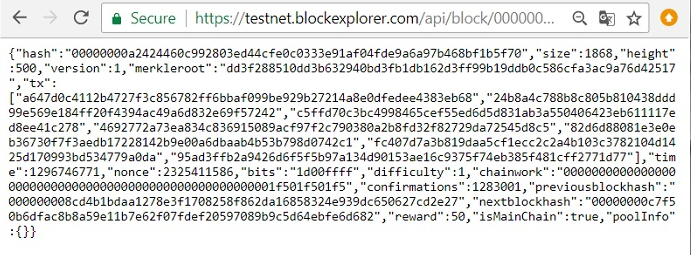
Most blockchain explorers are GUI based and rely upon a network node or set of them to GET relative data including not only the base transactions and mempool data but they can also display other data including peer (node) info and overall statistics.
Many of the blockchain explorers available are simple to use with a greater depth of functionality should that be needed, some like the following which push the boundaries for design and user feedback to a much greater degree with the following Bitcoin and other cryptocurrency blockchain explorers, in no particular order:
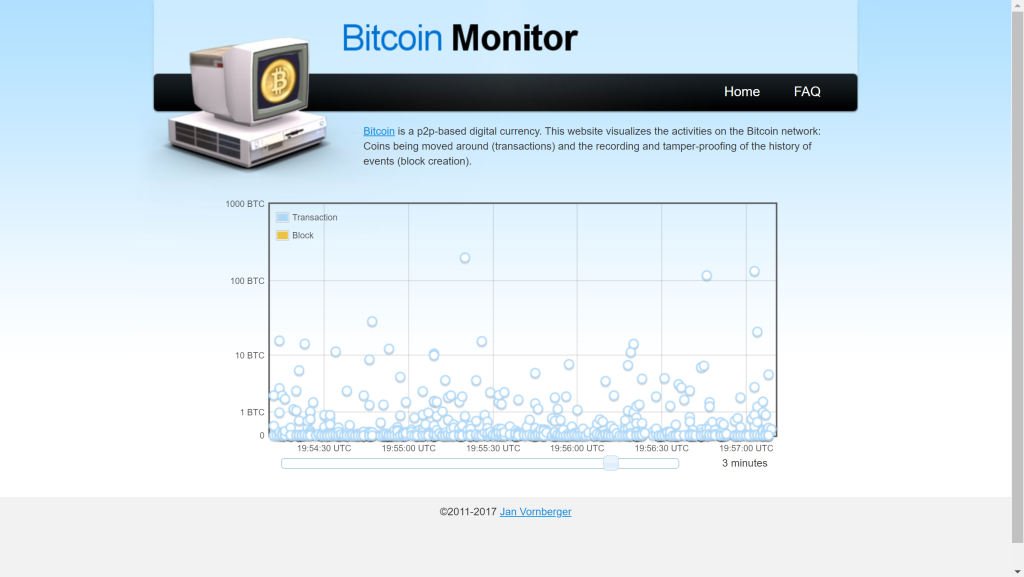
Bitcoin Monitor
https://www.bitcoinmonitor.com/
This website is still around from 2002 when it was first published, it still works well and uses an adjustable rolling time graph which shows upto date current Bitcoin transactions and blocks found.
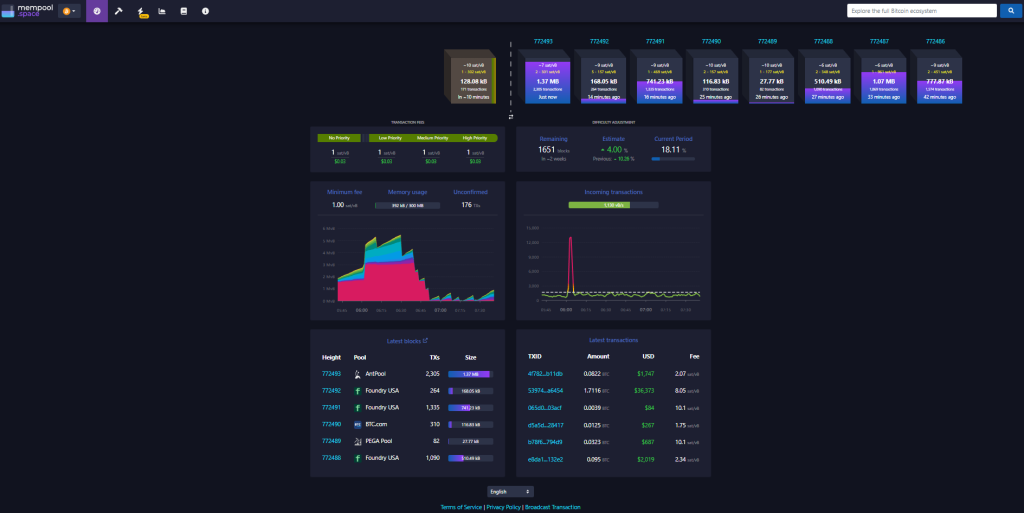
Mempool Space
https://mempool.space/
This site is super useful with the block visualisation progress it provides and I use it very often, you can input a transaction ID and it will follow it in real-time, which is very useful if you are waiting for a TX to confirm.
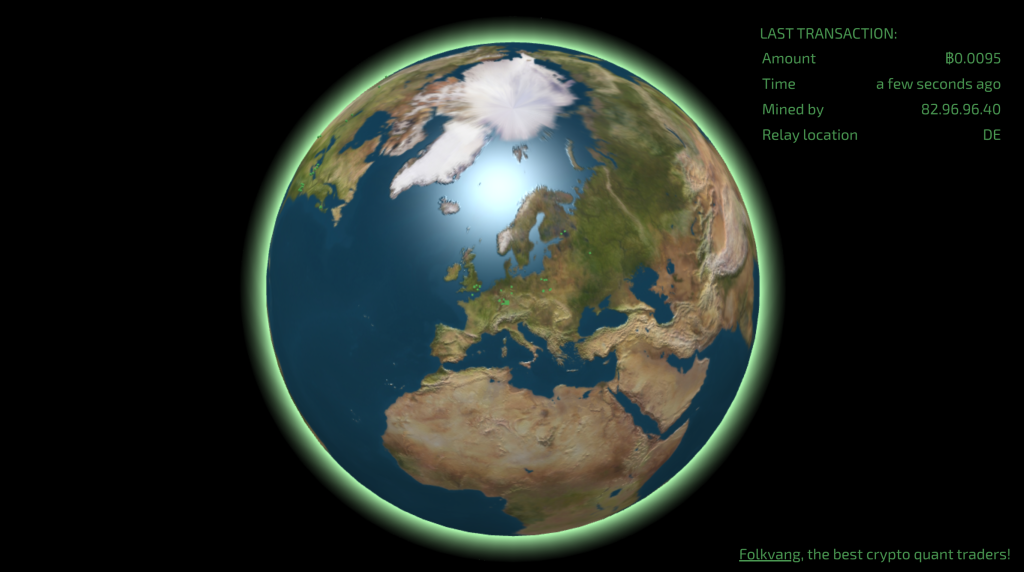
Blocks.wizb.it
Watch as the world jerks around when Bitcoin transactions start to confirm, new blocks are shown as well as other info like the TX amount, time, relay and associated miner fees.
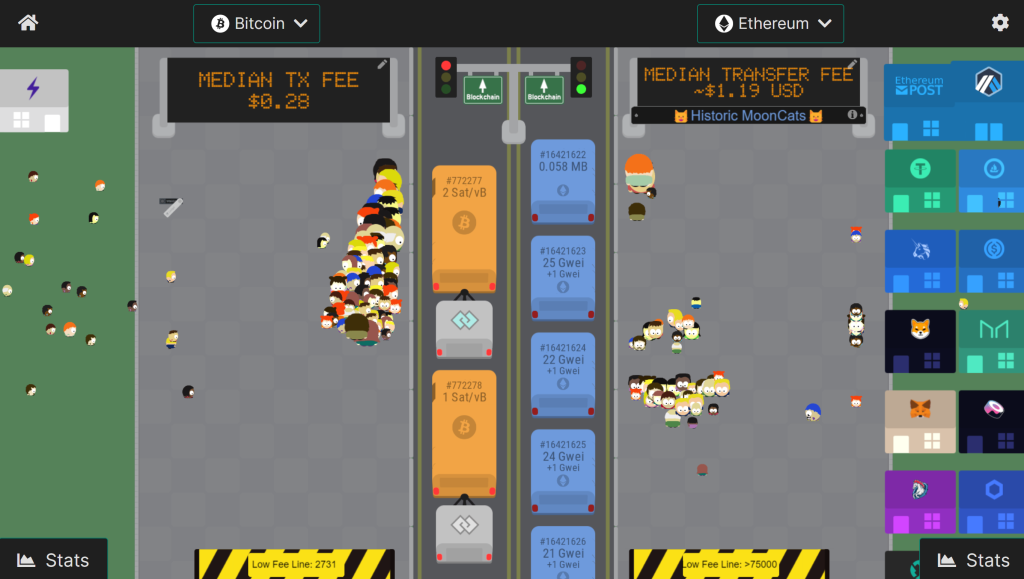
TX Street
https://txstreet.com/v/btc-eth
TX street uses similar characters as those on the South Park originally animated cult TV series. With the dual view showing, you can compare one blockchain network to another, you’ll get the most action from the BTC/ETC pair and can see just how many more transactions on the ETH network there are across the integrated networks than just the BTC transactions. The size of the characters arriving and alighting the bus represents the size of the actual transactions, other info and statistics are available too.
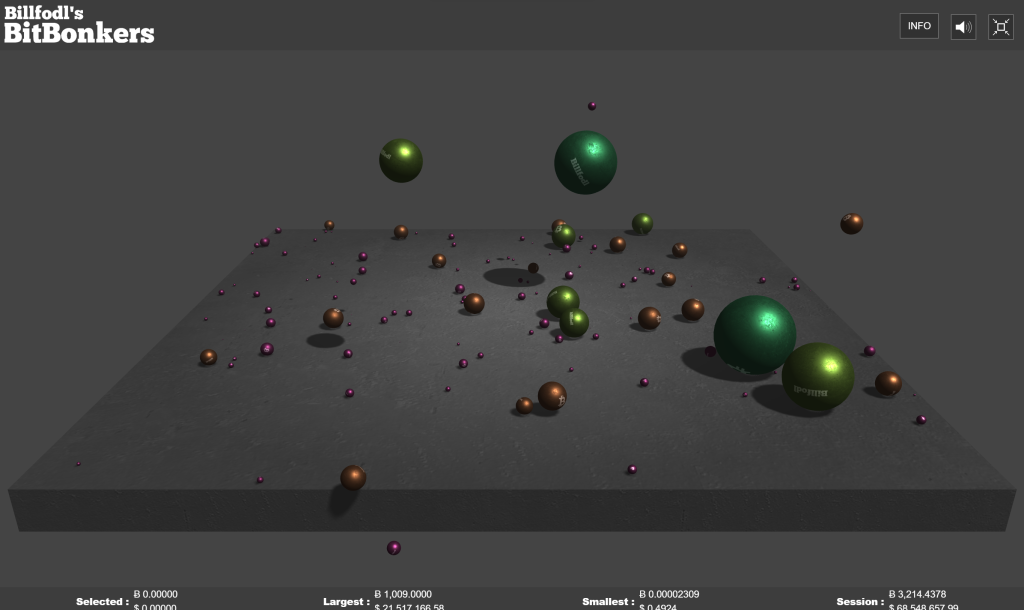
Bitbonkers
https://privacypros.io/tools/bitbonkers/
A 3D-rendered fun insight into the transactions hitting the Bitcoin blockchain network, the size of the balls represents the size of the transactions, change addresses included, you can click on the balls to see the relevant TX info.
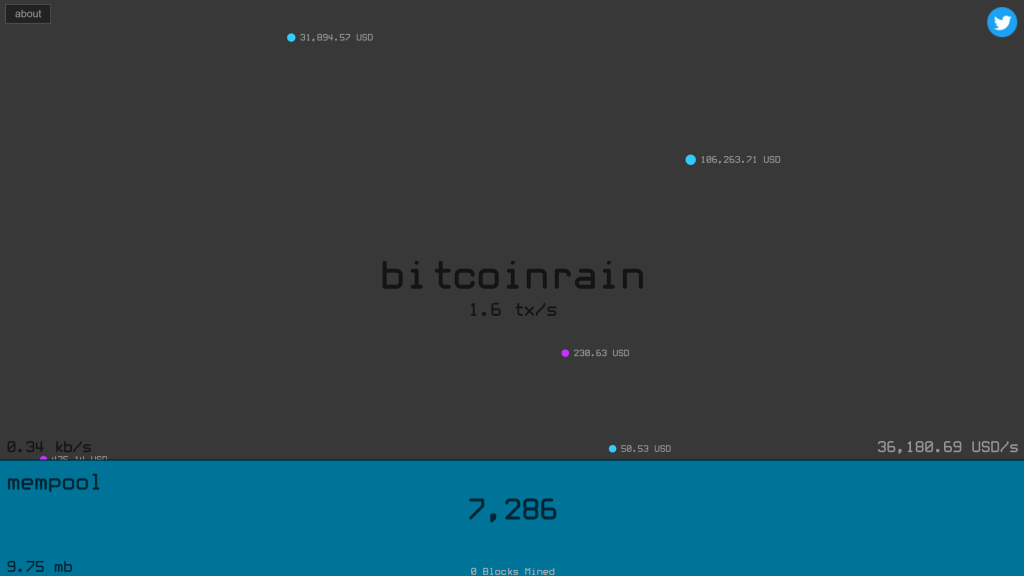
Bitcoin rain
http://bitcoinrain.io/
This website shows live Bitcoin transactions received by an independent node instance hitting the blockchain, blue raindrops show normal transactions whereas purple raindrops show Segwit transactions.
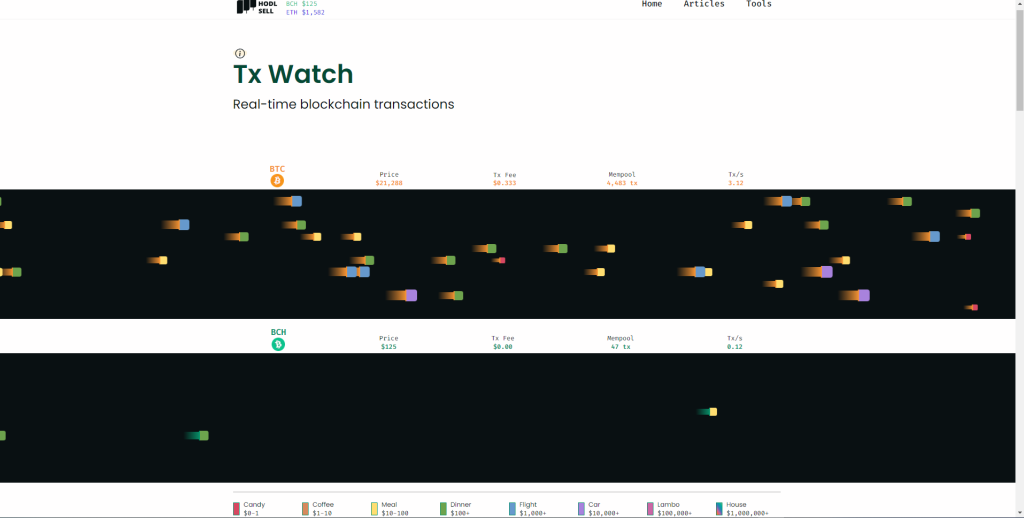
TX Watch
https://buyhodlsell.com/tx-watch
TX street shows two lanes of in-flow traffic, one carriageway represents Bitcoin BTC whereas the other lane represents Bitcoin cash BCH transactions, the developer has set the sizes of the transactions against real-life activities from coffee or candy right up to a Lambo and house which is a lot of fun. There are other indicators for the separate coin prices, amount of TXs with their transaction fees and the mempool size.
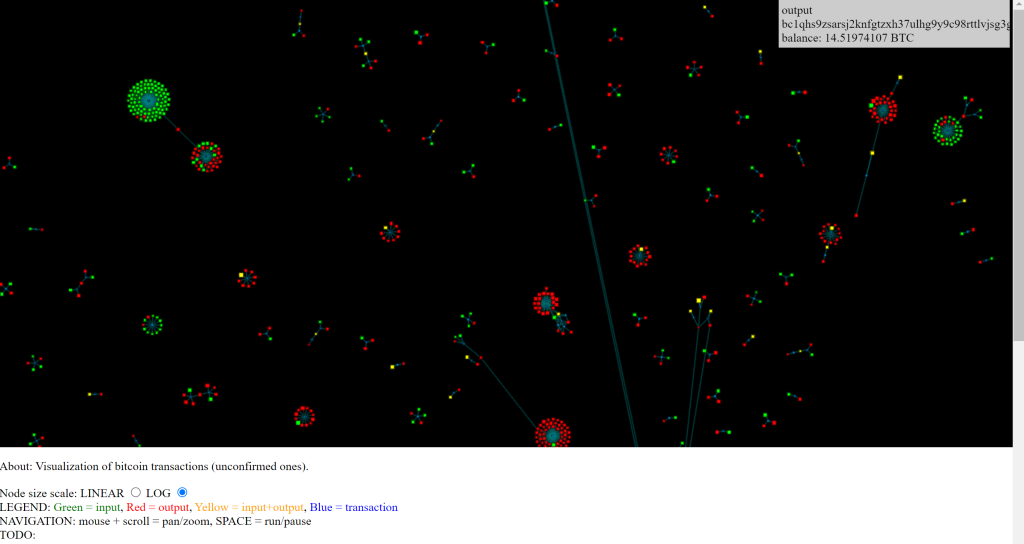
Daily Blockchain
https://dailyblockchain.github.io/
This website is pretty nuts, it shows UNCONFIRMED BTC transactions hitting the blockchain, then as time evolves, links between the transactions start to show with the associated coin movements starting to splice together in a heuristic form, like the DNA of Bitcoin that shows the liveliness and interlinking of the blockchain, this makes for some super interesting viewing the more it is watched.
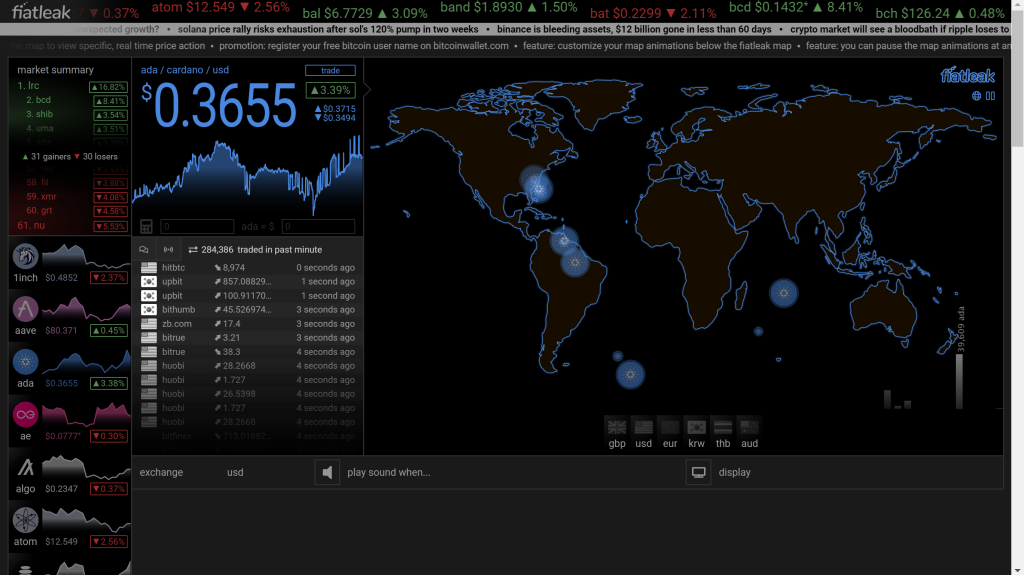
Fiat leak
A very highly visual website which covers a good selection of the major and some minor cryptocurrencies. With a world map either all the coins of a certain one can be chosen then transactions, both buys and sells are shown across the map and the pricing structure too, winners and losers are all here. Not only is this an interesting site that shows transactions across the board but this can also be utilised to watch for pumps, and dumps. There is news and views with links across the cryptosphere.
Digital currency blockchain explorers need not be boring interfaces, their sole purpose is to present data in an aggregated way for the user to interpret transactional and block data in a presentable format, you can see now there are other ways to present the data, some of these visual blockchain explorers are more useful than others in the depth of data they present but you can see there are other more fun and visual ways to represent this.


 hotspot mining, providing data to IoT devices")


